
People in a Mile
 Social Studies

 30 Min
 activity
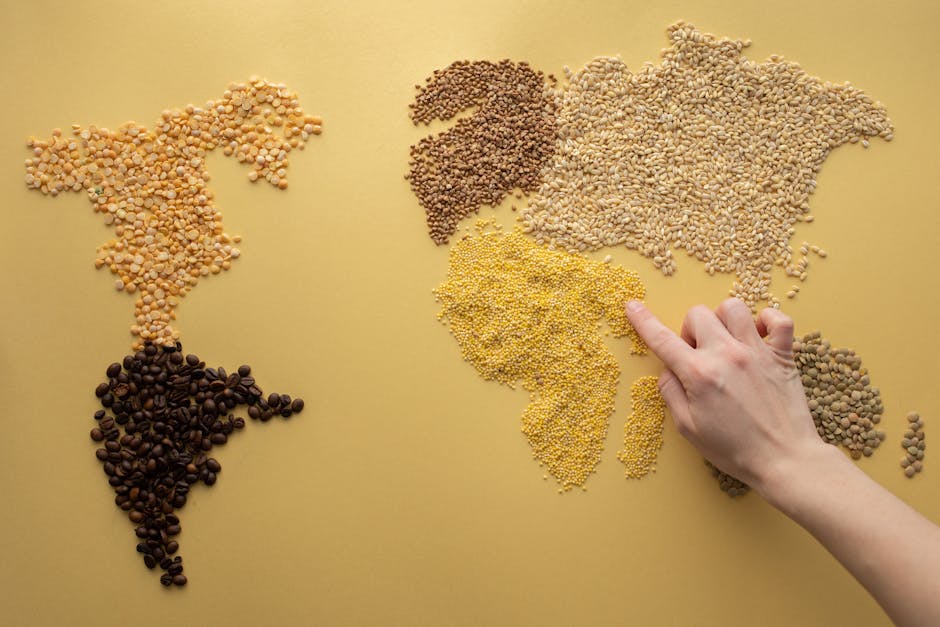
This Spark challenges families to visualize and understand population density by modeling how many people can live within a single square mile. Children will explore different population numbers for rural, suburban, and urban areas using common household items to represent people. It connects abstract geographical concepts to tangible, relatable experiences.
The lesson goal is learners will visualize a 'square mile' as an area and compare population densities across rural, suburban, and urban settings. They will understand how different spaces can accommodate varying numbers of people, connecting abstract concepts to real-world examples.
What You Need
Missing something? Don't let it stop you.
The app offers easy alternatives for every item you have at home.
Learning Guide
Step-by-step guidance. No preparation required.
- 1
Breakfast Table Buzz: Guessing Our Neighbors5 Min
- Ask about people at the breakfast table and how much space each person has.
- Discuss whether your neighborhood feels crowded or spread out.
- Move on when Child makes an initial guess or observation about the population density of their immediate surroundings.
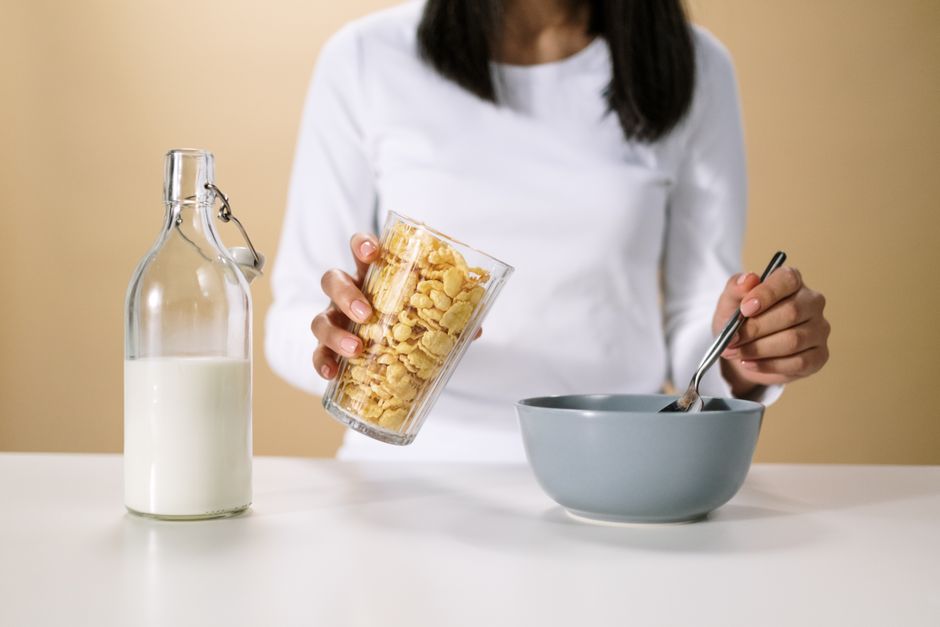 Photo by cottonbro studio on Pexels
- 2
Map Our Mile: Visualize the Space8 Min
- Talk about what a 'square mile' means and how to draw it on paper.
- Choose a small item, like cereal pieces, to represent people.
- Move on when Child has a plan for drawing a representative square area and has chosen an item to represent people.
 Photo by TLK GentooExpressions on Pexels
- 3
Density Unpacked: Rural, Suburban, City6 Min
- Explain 'population density' in simple terms.
- Share the population numbers for rural (10), suburban (2,000), and city (110,000) square miles.
- Ask which number is most surprising and why.
- Move on when Child can explain population density in their own words and has heard the example numbers for different areas.
 Photo by Jorge Alvarado Gutierrez on Pexels
- 4
Fill the Square: A Density Model9 Min
- Draw a large square on paper to represent one square mile.
- Choose two population types (e.g., rural, suburban) to model.
- Decide on a scale: how many people does one cereal piece represent?
- Place cereal pieces to model the first population, then observe.
- Clear the square and place pieces for the second population, then compare.
- Move on when Child has created physical models representing at least two different population densities using the cereal pieces within their drawn square.
Photo by Monstera Production on Pexels - 5
Our Crowded World: What We Learned2 Min
- Ask your child what they observed about sharing space in their models.
- Prompt them to share the most surprising thing they learned about population density.
- Move on when Child shares one key takeaway or surprising observation about population density.
 Photo by lidierme nascimento on Pexels
How many fit in one square mile?
People in a Mile
Social Studies30 MinactivityThis Spark challenges families to visualize and understand population density by modeling how many people can live within a single square mile. Children will explore different population numbers for rural, suburban, and urban areas using common household items to represent people. It connects abstract geographical concepts to tangible, relatable experiences.
Our Goal is learners will visualize a 'square mile' as an area and compare population densities across rural, suburban, and urban settings. They will understand how different spaces can accommodate varying numbers of people, connecting abstract concepts to real-world examples.
What You Need
Missing something? In the app, Mai suggests swap ideas.
Learning Guide
Step-by-step guidance. No preparation required.
- 1
Breakfast Table Buzz: Guessing Our Neighbors5 Min
- Ask about people at the breakfast table and how much space each person has.
- Discuss whether your neighborhood feels crowded or spread out.
- Move on when Child makes an initial guess or observation about the population density of their immediate surroundings.
Photo by cottonbro studio on Pexels - 2
Map Our Mile: Visualize the Space8 Min
- Talk about what a 'square mile' means and how to draw it on paper.
- Choose a small item, like cereal pieces, to represent people.
- Move on when Child has a plan for drawing a representative square area and has chosen an item to represent people.
Photo by TLK GentooExpressions on Pexels - 3
Density Unpacked: Rural, Suburban, City6 Min
- Explain 'population density' in simple terms.
- Share the population numbers for rural (10), suburban (2,000), and city (110,000) square miles.
- Ask which number is most surprising and why.
- Move on when Child can explain population density in their own words and has heard the example numbers for different areas.
Photo by Jorge Alvarado Gutierrez on Pexels - 4
Fill the Square: A Density Model9 Min
- Draw a large square on paper to represent one square mile.
- Choose two population types (e.g., rural, suburban) to model.
- Decide on a scale: how many people does one cereal piece represent?
- Place cereal pieces to model the first population, then observe.
- Clear the square and place pieces for the second population, then compare.
- Move on when Child has created physical models representing at least two different population densities using the cereal pieces within their drawn square.
Photo by Monstera Production on Pexels - 5
Our Crowded World: What We Learned2 Min
- Ask your child what they observed about sharing space in their models.
- Prompt them to share the most surprising thing they learned about population density.
- Move on when Child shares one key takeaway or surprising observation about population density.
Photo by lidierme nascimento on Pexels
In The Mai App
Bring This Spark To Life
Same Spark, with Mai by your side
Mai Leads It
Mai leads the Spark out loud, so they can learn on their own.
Step-By-Step
Get every step with Mai's tips, one at a time, at your pace.


Quick Swaps
Missing something? Mai suggests swap ideas, so you can start now.
Beyond The Spark
After, a fun fact, a challenge and a Table Talk question.