
People in a Mile
This Spark challenges families to visualize and understand population density by modeling how many people can live within a single square mile. Children will explore different population numbers for rural, suburban, and urban areas using common household items to represent people. It connects abstract geographical concepts to tangible, relatable experiences.
Our goal: Learners will visualize a 'square mile' as an area and compare population densities across rural, suburban, and urban settings. They will understand how different spaces can accommodate varying numbers of people, connecting abstract concepts to real-world examples.
What You Need
Breakfast cereal • Large sheet of paper • Ruler • Pencil • Calculator
and this is just the baseline.
Scan to jump into the app and easily personalize this Spark to match your child's exact learning level and see how Mai will guide this lesson.
Learning Guide
A simple guide to lead you through the kickoff, the core challenge, and everything in between.
Mai’s Tips
- Scale is key: The biggest conceptual jump for this Spark is understanding scale – how a few cereal pieces can stand for thousands of people. Don't rush this. If the child is struggling, simplify the scale (e.g., 1 cereal piece = 1 person for rural, then for suburban, say 'imagine each cereal piece is actually 100 people').
- Misconception alert: Children might think a 'square mile' is a single building or a small park. Emphasize that it's a huge area, the size of many blocks or even a small town. Walking the perimeter of a block or pointing to a large park can help them grasp the scale of a mile.
- Simplify for younger learners: For younger children, focus on the visual comparison: 'Which one looks more spread out?' and 'Which one looks more crowded?' They don't need to do precise calculations but can still grasp the concept of 'many' vs. 'few' people in the same space.
- Challenge for older learners: Encourage older children to calculate the exact number of cereal pieces needed for each scenario given a chosen scale. Ask them to think about how many square feet one person would have in each scenario, or how many multi-story buildings would be needed to house 110,000 people in one square mile.
1Breakfast Table Buzz: Guessing Our Neighbors 5 min
Start the conversation while still at the breakfast table, using something on the table to spark thinking about 'space' and 'people'. Have your child consider their immediate surroundings and then expand to their neighborhood.
- How many people are at our breakfast table right now? How much space does each person have?
- Now, think about our street or neighborhood. Do you think lots of people live close together, or are houses usually far apart here?
- What makes you say that? Is our neighborhood crowded or more spread out?
Know Before You Teach
- Good to know: Population density is about how many individuals live in a given space.
- Your immediate surroundings (home, street) are small-scale examples of population density.
- If they ask: Is our neighborhood crowded? It depends on how many people live on each street compared to how much open space there is. We'll explore what 'crowded' means with numbers soon!
- It's working when: Child pointing to empty or full spaces around them when discussing density.
- If they're stuck: Ask them to count how many people fit comfortably on just one couch or chair.
- Easier: Focus only on who is in the room and how much space they have.
- Harder: Ask them to estimate how many households live on their block and then discuss if that feels dense.
Done when: Child makes an initial guess or observation about the population density of their immediate surroundings.

2Map Our Mile: Visualize the Space 8 min
Introduce the idea of a 'square mile' as a unit of land. Guide your child to think about how to represent this large area on paper and what common household items could represent people. Younger children can focus on drawing a simple square and picking cereal; older children can discuss scaling.
- What does 'one square mile' mean to you? How big do you think that is?
- If we wanted to show a square mile on this piece of paper, how could we draw it?
- What could we use from around the house to represent people living in that square mile?
Know Before You Teach
- Good to know: A 'square mile' is a unit of area, roughly 2.6 square kilometers, which is a very large piece of land. It's often used to measure population distribution.
- Models help us understand very large or very small concepts by scaling them down.
- Key words: Square mile: An area of land that measures one mile on each of its four sides.
- It's working when: Child understands that the paper square represents a much larger real-world area.
- If they're stuck: Suggest drawing the square first, then ask what tiny things they have that could represent people.
- Easier: Just draw any square and pick any small object without worrying about scale yet.
- Harder: Ask them to calculate how many football fields would fit into one square mile (about 25,600 fields).
Done when: Child has a plan for drawing a representative square area and has chosen an item to represent people.

3Density Unpacked: Rural, Suburban, City 6 min
Explain 'population density' as how many people live in a certain amount of space. Share the numbers for rural, suburban, and city areas. Engage both younger and older children by asking for their predictions and reactions to the numbers. Younger children can focus on 'more' or 'less' people; older children can think about the scale of difference.
Population density is how many people live in a specific amount of space, like a square mile. If an area has high density, it means lots of people live close together. Low density means people are more spread out.
- Where do you think more people would live: on a farm, in a neighborhood like ours, or in a busy city?
- A rural square mile might have only 10 people. A suburban square mile (like many neighborhoods) could have 2,000 people. A city square mile can have over 110,000 people!
- Which of those numbers surprises you the most, and why?
Know Before You Teach
- Good to know: Population density varies significantly from rural (low density) to urban (high density) areas.
- If they ask: Why do cities have so many people? Cities often have more jobs, schools, services, and opportunities, so many people move there to live and work.
- Key words: Rural: Open countryside, often with farms and very few houses spread far apart.
- Key words: Suburban: Neighborhoods with many houses and some businesses, often just outside a city.
- Key words: City: A large, densely populated urban area with many buildings, people, and services.
- It's working when: Child showing surprise or curiosity about the large differences in numbers between areas.
- If they're stuck: Ask which type of place (farm, neighborhood, city) they would expect to see the most cars, people walking, or tall buildings.
- Easier: Focus on just two types, like 'farm' vs. 'city' and notice the big difference.
- Harder: Ask them to describe what life might be like in a place with 10 people per square mile versus 110,000.
Done when: Child can explain population density in their own words and has heard the example numbers for different areas.
4Fill the Square: A Density Model 9 min
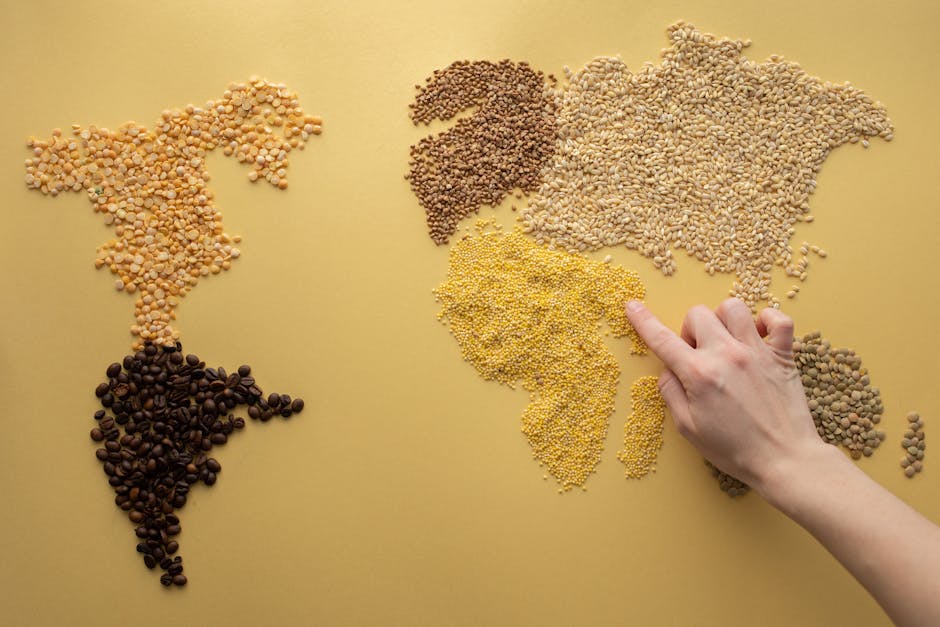
Help your child draw a square on the paper (e.g., 20x20 cm or 8x8 in) to represent 'one square mile'. Guide them to choose two population scenarios (e.g., rural and suburban) and decide on a scale for the cereal pieces (e.g., 1 cereal piece = 100 people, or 1 cereal piece = 10 people for smaller numbers). Then, have them place the cereal pieces. Younger children can focus on the visual difference; older children can calculate the number of cereal pieces needed.
- Draw a square on your paper. This is our 'square mile'.
- Let's pick two places to model: rural (10 people) and suburban (2,000 people). How can we use our cereal pieces to show these numbers?
- If one cereal piece equals 10 people, how many pieces do we need for rural? How many for suburban?
- Place the cereal pieces for your first model. What does it look like? Now, clear it and place them for the second. What's different?
Know Before You Teach
- Good to know: Modeling abstract concepts, like density, makes them tangible and easier to compare visually.
- Choosing an appropriate scale is crucial for accurate representation in models (e.g., 1 cereal piece = 100 people).
- Key words: Scale: The relationship between the size of something on a map or model and its actual size in the real world.
- It's working when: Child physically comparing the spread of cereal pieces between different models, noting which is more crowded.
- If they're stuck: Start with the rural model (1 cereal piece per person, 10 pieces total) to build confidence, then discuss how to scale up.
- Easier: Just place a few pieces for 'rural' and a lot of pieces for 'suburban' without precise counting, focusing on the visual contrast.
- Harder: Have them try to model all three scenarios, calculating the exact number of cereal pieces for each based on a consistent scale, and discussing the challenges of modeling the city.
Done when: Child has created physical models representing at least two different population densities using the cereal pieces within their drawn square.

5Our Crowded World: What We Learned 2 min
Have your child reflect on the models they created and the numbers they learned. Encourage them to articulate what they found most surprising or interesting about population density. Both younger and older children can share their thoughts.
- Looking at your models, what did you notice about how people share space in different areas?
- What was the most surprising thing you learned today about how many people can live in one square mile?
Know Before You Teach
- Good to know: Population density influences various aspects of life, from resource distribution to personal space.
- Understanding density helps us appreciate the diversity of human settlements and the challenges/opportunities they present.
- If they ask: Is it better to live in a high or low density place? There's no 'better' answer – it depends on what you like! Some people love the quiet and open space of low density areas, while others love the energy and convenience of high density cities.
- It's working when: Child connecting the visual models to their own understanding of different types of places they've seen or heard about.
- If they're stuck: Ask them to describe their favorite part of the activity or which model they found most interesting.
- Easier: Simply ask them to point to the model that looked 'most empty' and 'most full'.
- Harder: Ask them to think about how population density might affect things like traffic, nature, or the number of stores in an area.
Done when: Child shares one key takeaway or surprising observation about population density.
Beyond The Spark
Fuel their curiosity beyond the Spark with bonus extras.
Table Talk
Understanding population density helps city planners design neighborhoods, allocate resources like schools and hospitals, and manage traffic flow for millions of people.
Did You Know?
Did you know that the city of Manila packs over 111,000 people into just one square mile? That's more than many entire towns!
Challenge
If you modeled rural and suburban, now try to model the city mile! How would you even begin to show 110,000 people? Maybe you need to change what one cereal piece represents again!
Quick Recap Quiz 4 min
Customize this quiz, add questions, or follow your child's lead! Each question has a 'Parent Tip' to help them find the answer without giving it away.
1. What does 'population density' tell us?
- How many buildings are in a city
- How many people live in a certain amount of space
Population density is about people per area, not just buildings.
2. Which area typically has the lowest population density?
- Rural area (like farms)
- City center
Think about where people are most spread out.
3. If you see a lot of cereal pieces packed tightly in your 'square mile', what does that mean?
- The area has low population density
- The area has high population density
More pieces in the same space means more people.
4. Why is it useful for city planners to understand population density?
- To decide where to build schools and parks
- To know what kinds of cars people drive
Think about what a city needs for its residents.
Loved This Spark?
Scan to jump into the app and explore similar Sparks in our Sparks Hub. New to Mai? Start free with 10 Sparks, no credit card needed.